Introduction
Key takeaways from the CERRIX webinar Your risk data knows how your organisation handles risk. Do you? with Jeroen Tacke (Senior Risk Consultant, ARCOTA Consulting) and Ruben Andeweg (Senior Risk Management Consultant, CERRIX).
Most organisations measure their risks. Few measure their own ability to handle them, yet the signals are already in the GRC tool.
Every improvement action, every due date and every rejected assessment leaves a trace. Red remarks, green remarks, comments, workflow steps. Most teams use that data to report on their risks. Far fewer use it to understand how their organisation actually behaves around risk.
That was the starting point of the session. Jeroen has worked in risk management and compliance in the financial sector for 30 years. Ruben knows the CERRIX platform from the inside, first as product owner and now as consultant. Their shared view: a platform can show the data, but that is where the real story begins.
This blog covers the three behavioural signals discussed in the webinar, how to read them, and why the conversation matters more than the number.
Reactive or proactive: where does your organisation stand?
The session opened with a simple distinction. Reactive risk management is about limiting the damage once something has happened. Proactive risk management is about anticipating, and making the effort to stop things from happening in the first place.
It is not black and white. Some reactive work will always be part of the job. Proactive is the next step up in maturity.
Why do people stay reactive? Often it is not a lack of willingness. They lack insight, or they lack a trigger. And many organisations have never defined what proactive means for them. Without a shared view and a shared ambition, discussions go round in circles.
There is an external push too. Jeroen pointed to the ECB's guide on governance and risk culture, which makes clear that supervisors expect banks to keep strengthening the way they manage risk.
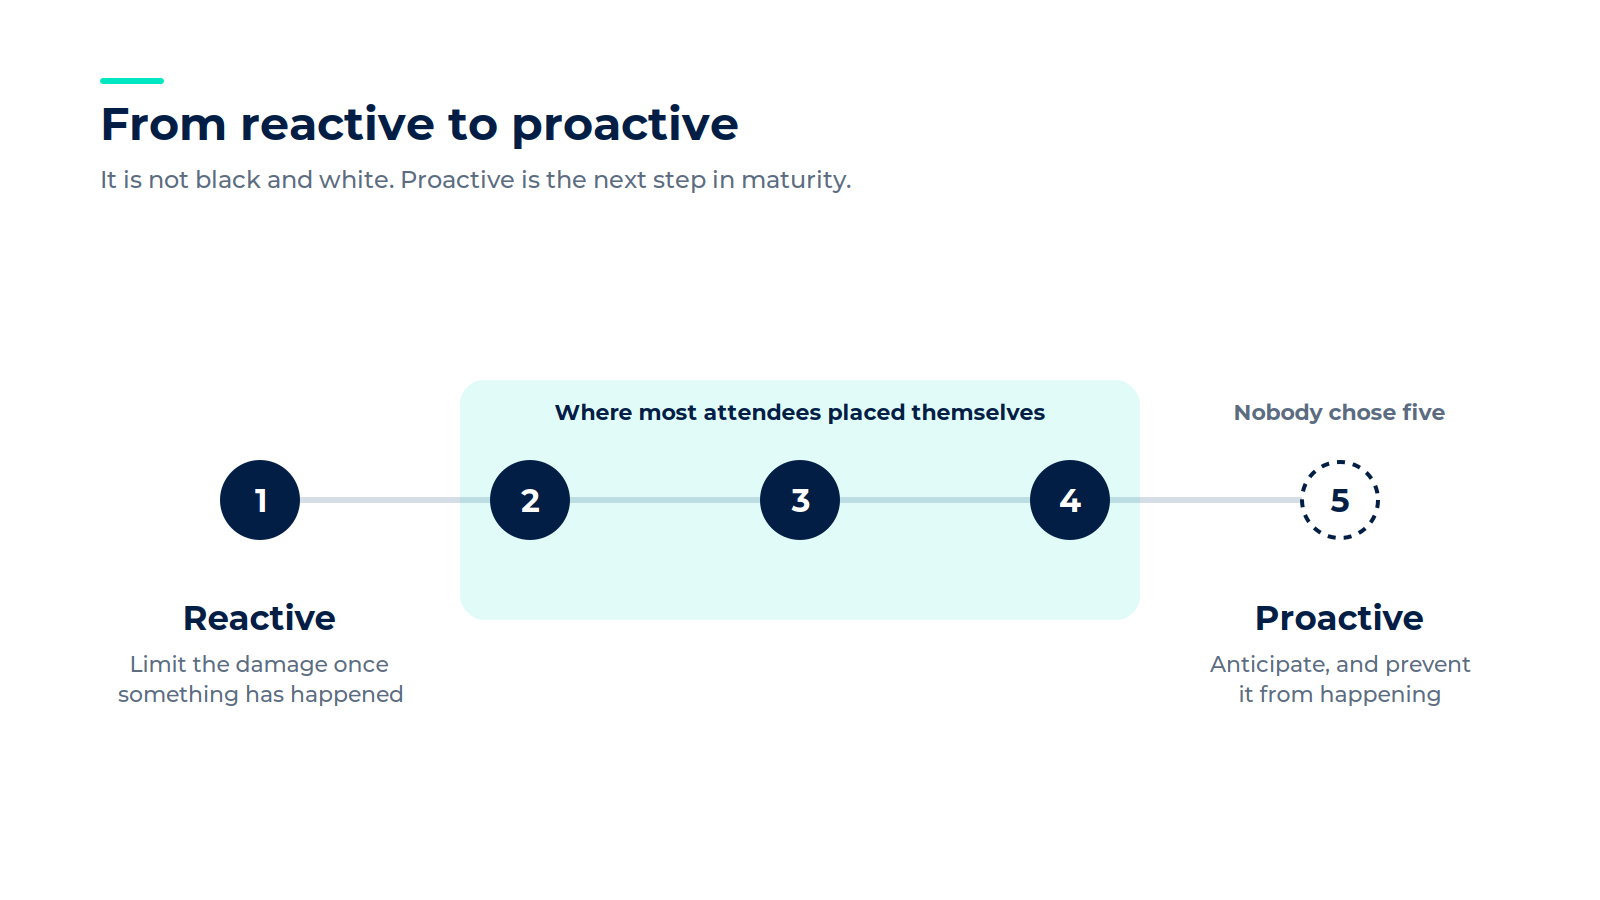
A live poll asked attendees to rate their organisation on a scale from one (reactive) to five (proactive). The answers were spread widely. Most people placed themselves in the middle, and nobody chose five. As Jeroen noted, the answer also depends on who you ask: the first, second and third line often see the same organisation differently.
"Being very reactive means you are probably a bit late, with the risk of higher-impact incidents or more findings from internal audit, external audit or even the regulator. Being proactive means a transparent organisation, where a manager who raises a finding on their own is not cut off for it, because they show they want to improve." Ruben Andeweg, Senior Risk Management Consultant, CERRIX
Three signals already in your GRC data
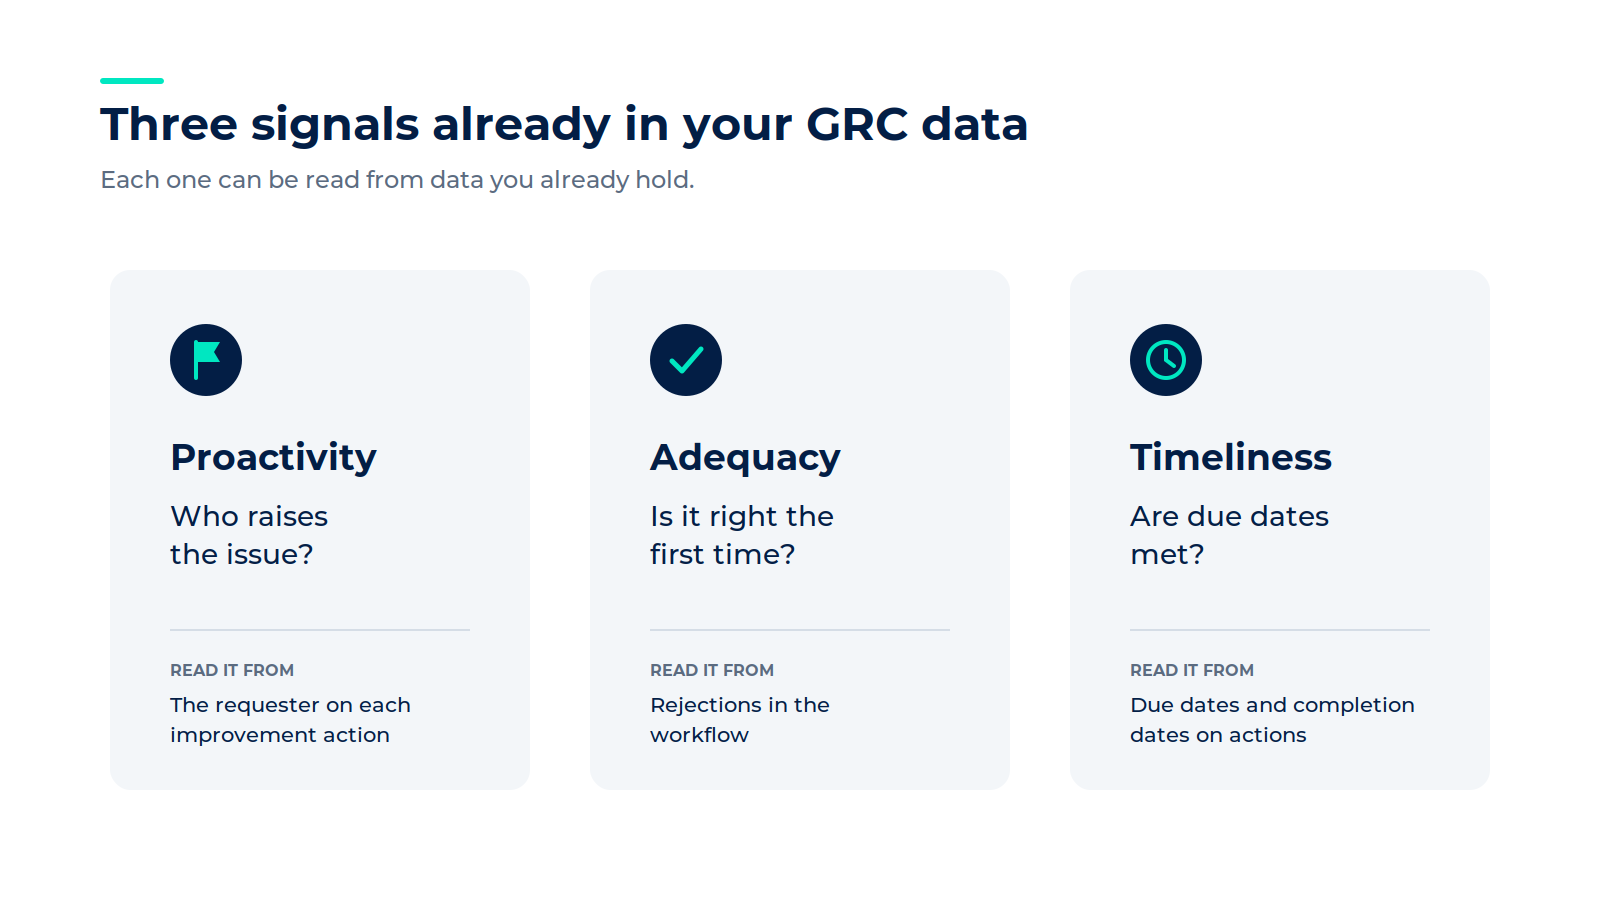
Many organisations already report on whether due dates are met. But the metadata in a GRC platform says much more than that. Three signals came up in the session: proactivity, adequacy and timeliness. Each one can be read from data you already hold.
Proactivity: who raises the issue?
Every measure of improvement (MOI) in CERRIX registers a requester, linked to a role group. That shows directly where issues come from: the business itself, second-line risk management, or internal audit.
"If you want the first line to really own risk, you would also expect them to signal where their risks are not properly managed, and to take action to bring that back to where it should be." Jeroen Tacke, Senior Risk Consultant, ARCOTA Consulting
There is no single right percentage, though. Senior management may choose a strong, well-staffed audit function and accept that the first line self-identifies a little less. The point is to ask the question. Why do you wait for audit? Why not raise it yourself? And if there is an objection, perhaps a fear of closer scrutiny, that objection is exactly what the conversation should be about.
Adequacy: is it right the first time?
First-time right looks at which improvement actions are completed without being rejected. In the demo, Ruben compared departments. In one, half of the actions were rejected the first time. In operational processes, the first-time-right rate was far higher.
"It's not about beating finance. It's about seeing how another part of the organisation gets to a much higher number, what they could share, and what the reasons behind the difference are." Jeroen Tacke, Senior Risk Consultant, ARCOTA Consulting
Timeliness: are due dates met?
Per quarter, you can see how many improvement actions were completed on or before their due date. Most organisations already track this. The more telling part is the pattern behind the number.
Are actions finished steadily along the way, or do they pile up in the last week before the quarterly report? Are due dates met as originally set, or pushed back again and again? The first pattern points to people who manage risk as part of their daily work. The second points to risk work that is driven by the report. That is the reactive behaviour Jeroen described earlier: waiting until something shows up in a report before acting on it.
Neither pattern is a verdict on its own. But a department that always closes on the deadline, or keeps moving it, is a good place to ask why.
One more signal: when tester and reviewer disagree
In effectiveness testing, a tester in the business and a reviewer in the second line do not always reach the same conclusion on a control. Frequent disagreement in one department is worth a conversation. So is a department where they always agree.
"If you base these discussions on intuition, they quickly become a yes-no discussion. If you can show that you have looked at a full year, compared it with neighbouring departments and see a much lower percentage, it is still not an easy conversation. But at least you start from a more objective view." Jeroen Tacke, Senior Risk Consultant, ARCOTA Consulting
The examples in the webinar focused on improvement actions, but the same view works for control testing, incident management or any workflow with a due date. The data can come from standard widgets, exports from the registers, or an API into your own reporting tool.
A conversation starter, not a scorecard
If there was one message Jeroen repeated, it was this: do not start by setting targets.
"This data gives you a basis to talk to people in your organisation. In my personal opinion, it's very important not to start setting targets, but to use the information to have the conversation. What is happening here? How can we make things better? Do we all look at it the same way?" Jeroen Tacke, Senior Risk Consultant, ARCOTA Consulting
Or as Ruben put it: there is no right or wrong. There is just information.
Jeroen shared an example of how this can go wrong. In one organisation, managers were open and self-identified their issues. Senior management then came down on them for having so many. That is exactly the wrong signal. A fixed target, say 75% self-identified, does not work either. The aim is to learn from each other, not to put some people on a blacklist and others on a happy list.
One data set, everyone at the table
Another poll asked where attendees bring this data into the conversation today: with senior management, with the business, or both. "Both" was by far the most common answer.
That matters. Jeroen described a case where reports went only to senior management. They went one layer down and started asking pointed questions, and the layer below had no idea what they were talking about. Different layers can get different perspectives. But everyone should know it comes from the same data, so nobody is surprised.
"Everyone can have their own view on things, as long as you look at the same data. If everybody looks at it in a different way, the conversations get much harder." Ruben Andeweg, Senior Risk Management Consultant, CERRIX
Where to start
The second poll asked whether attendees were happy with their current level. A large majority said they still had work to do, some of them significant work.
Jeroen's advice depends on the size of that gap. Being proactive has a price tag, and an ambition set too high can mean you never even reach the middle step. So if the gap is large, start at the top. Make sure senior management sees it the same way you do before you take it into the business. Ruben summed it up in Dutch: neuzen dezelfde kant op, everyone facing the same direction. Then go to the business: this is where we want to go, and this is what it means for your responsibilities.
If you are somewhere in the middle, you can start smaller. Use the data to find the departments where there is most to gain, and begin there.
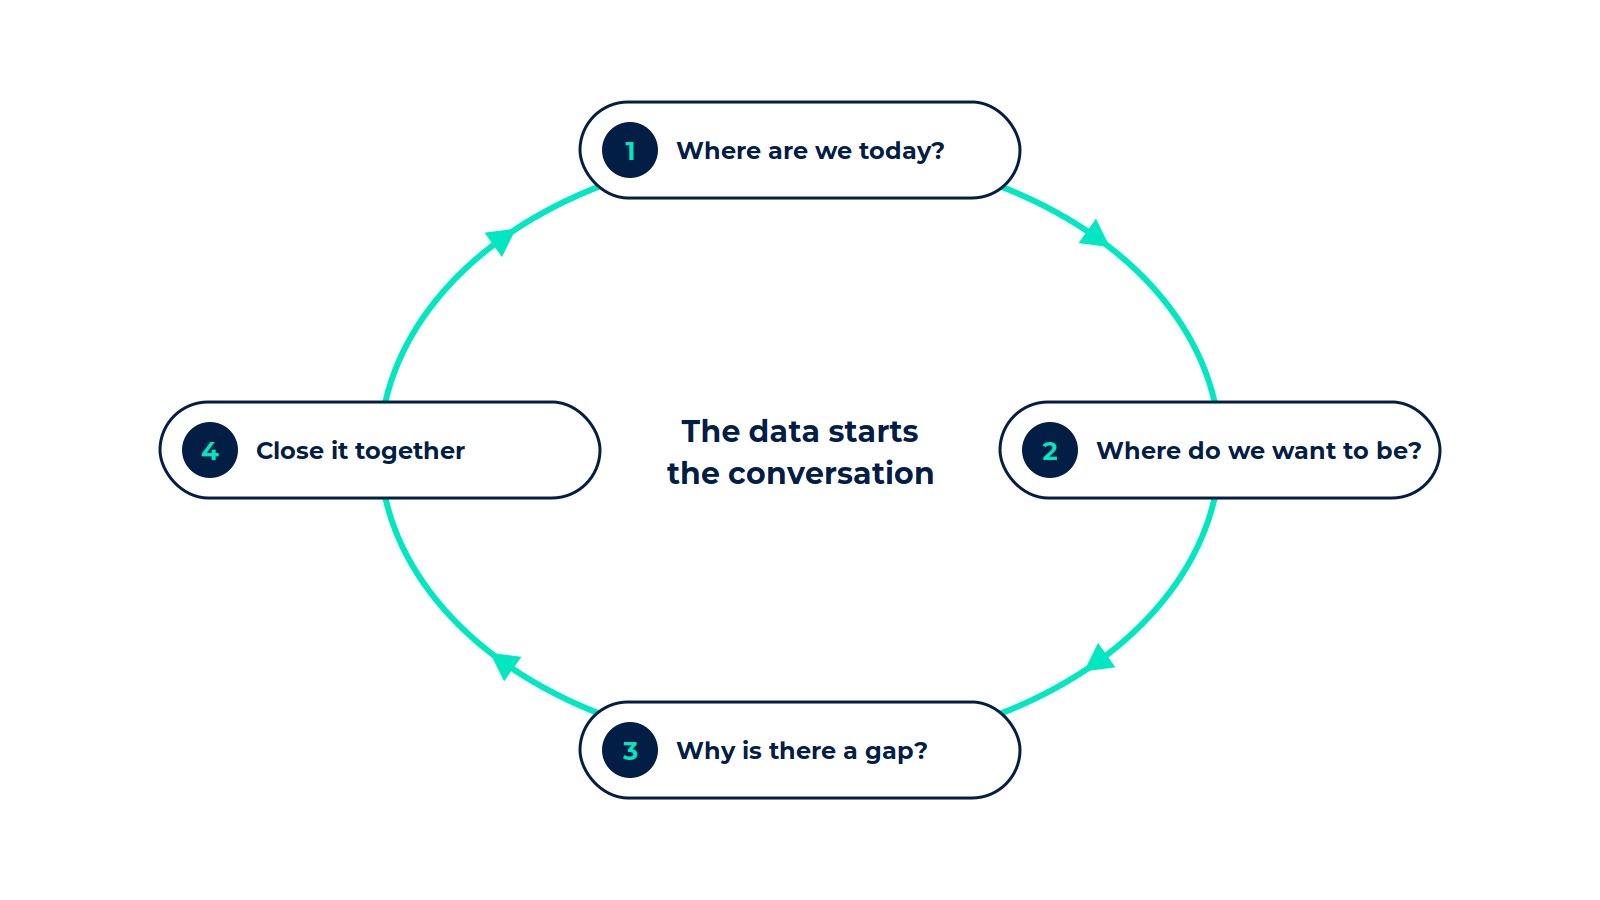
From there, the approach is a simple loop:
"The goal is not the platform. The goal is not the data. It should give you more information for better decision-making." Ruben Andeweg, Senior Risk Management Consultant, CERRIX
That is where the shift from compliance-driven to intrinsically motivated risk management begins. Not with a new rule or a new target, but with people who see the data, understand it, and want to do things differently.
"It's really about influencing behaviour. Having people look at things in a different way, and want to do things in a different way." Jeroen Tacke, Senior Risk Consultant, ARCOTA Consulting
Watch the full webinar
Want to see the examples for yourself? Watch the full webinar on demand, or get in touch with our team to explore what your own risk data says.
Frequently asked questions
What are behavioural signals in risk management? Patterns in how people handle risk, read from the metadata in your GRC platform. Three useful ones are timeliness (are due dates met), proactivity (who surfaces issues, the owner or the auditor) and adequacy (are issues resolved right the first time).
Do we need new data to understand our risk culture? No. Requesters, due dates, rejections and review outcomes are already recorded in most GRC platforms. The question is whether you are reading them.
Should we set targets on these indicators? Not at the start. Use the data to open the conversation first. Fixed targets, such as a required percentage of self-identified issues, can send the wrong signal and discourage transparency.
Who should see this data? Both senior management and the business. Each layer may need a different view, but everyone should be working from the same data set so there are no surprises.
Where do we start? If the gap between where you are and where you want to be is large, align with senior management first. If it is smaller, start with the departments where the data shows the most to gain.
Three signals in your GRC data that show how your organisation handles risk
Takeaways from the CERRIX webinar with Jeroen Tacke and Ruben Andeweg: three signals in your GRC data that show how your organisation handles risk.
.png)
CERRIX vs Diligent: GRC software compared across features, European market fit and compliance
A side-by-side look at two GRC platforms, and which one fits the DORA, NIS2, and ISQM obligations European teams carry.
.png)
Conversational GRC: work with your risk data from the AI agent you already use
Query your controls, update tasks, and generate board-ready reports, all from Claude, Microsoft Copilot or another AI agent.
.jpg)
CERRIX vs ServiceNow: GRC software compared across features, pricing, and compliance
CERRIX vs ServiceNow: GRC Software compared across features, pricing, and compliance (2026)
.jpg)
AI in GRC: beyond the hype. What actually works at every level of adoption
Key takeaways from the CERRIX panel on AI in GRC, with practitioners from CERRIX, AuditAgent and 8weeks.co sharing what actually works.
.avif)
Top European GRC tools in 2026: An insider's comparison
This blog compares the top GRC platforms available to European organizations in 2026

What Does GRC Look Like in 2030?
By 2030, AI in GRC will automate evidence collection, control monitoring, and routine reporting across all three lines of defense, shifting risk managers from administrative work to strategic advisory roles

The Complete GRC Chain: Connecting Regulatory Change Management, Risk, and Controls in One Platform
The future of Governance, Risk & Compliance (GRC) lies in connecting regulatory change management directly to risks, controls, incidents, actions, and assurance activities in one integrated platform.

Embedding automation into your risk operating model: Where AI fits and how to make It work
This second part focuses on what makes that automated model intelligent. Where AI fits. What it means for risk professionals in practice.

From checkbox to continuous: How to embed automation into your risk operating model
What it means to truly embed automation into the risk operating model: what changes, what stays the same, and what it takes to make it work in practice.
.jpg)
Why CERRIX acquired Ruler, and what it means for the future of GRC
CERRIX acquires Ruler to connect regulatory change with risk management.
%20(1).png)
Why Data Quality Is the Foundation of AI and Automation in GRC
A strategic look at why structured data in a GRC tool is imperative for automation, AI enabled workflows, and real time risk insights.
.jpg)
Internal Control Framework Challenges: Why COSO and ISO 31000 Implementations Struggle in Practice
Why do internal control framework implementations (COSO, ISO 31000) struggle? Explore common challenges in process design, ownership, tooling, and governance
%20(3).jpg)
Control Assurance Explained: How Organizations Move from Control Testing to Continuous Monitoring
Discover how modern control assurance moves beyond periodic testing to continuous monitoring, with clear ownership, automation, and expert opinion.

Incident Management under DORA: What Risk and Compliance Leaders Need to Rethink
Incident Management under DORA: What Risk and Compliance Leaders Need to Rethink
.jpg)
How to Apply ISO 31000 Risk Treatment in Practice: Insights for Risk and Compliance Leaders
A practical recap of CERRIX ISO 31000 risk treatment webinar
%20(1).jpg)
How We Use CERRIX GRC to Manage Our ISMS: ISO 27001 in Practice
We use our own CERRIX GRC software to manage CERRIX’s ISMS, turning compliance into confidence and showing how ISO 27001 can become part of daily business practice.
.jpg)
Why the Three Lines of Defense Model Is Outdated? What Every Board Should Know About the Three Lines Model
Three Lines Model Explained: Why Boards Must Move Beyond 3LOD
.jpg)
What Is ISO 31000 and How Does It Work?
Discover what ISO 31000 is, how it works, and why it’s essential for risk management in 2025. Learn the principles, framework, and how tools like CERRIX help organizations turn ISO 31000 into practice.
.jpg)
How to Write an Incident Report That Stands Up to Audits
Learn how to write incident reports that are clear, evidence-backed, and audit-ready. Includes a template, best practices, and compliance alignment for risk professionals.
.jpg)
How to Implement ISO 31000: Real-Time Risk Decisions with AI‑Enabled Tools
Discover how to move beyond compliance and operationalize ISO 31000 using AI, real-time dashboards, and structured risk assessments. Learn from webinar insights and best practices tailored for financial services and regulated industries.
%20(1).jpg)
What’s Blocking Your ISMS Rollout? 7 Fixable Challenges for Financial Institutions
Discover the 7 biggest blockers in ISMS rollout for financial institutions—and how to solve them. Learn practical strategies to secure buy-in, define scope, streamline controls, and prepare for ISO 27001 certification.
.jpg)
Trends Driving ISMS Adoption in 2025: What Risk & Compliance Leaders Need to Know
Discover the top trends pushing organizations toward ISMS adoption in 2025—from regulatory changes and remote work to threat evolution and AI. Learn what to prioritize to stay ahead in risk and compliance.
%20(1).jpg)
What Is an ISMS? A Practical Guide for Risk & Compliance Leaders in 2025
An Information Security Management System (ISMS) is more than policy—it’s your organization’s shield against evolving threats, regulation, and reputation risk. Discover what ISMS means, how to implement it, and why it matters in 2025.
.jpg)
The Intelligent Future of GRC: How AI is Reshaping Governance, Risk & Compliance in 2025
Explore how AI is transforming GRC in 2025—from predictive insights and automation to ethical oversight. Learn what features matter, what risks to manage.
.jpg)
How Do You Implement an ISMS in Financial Services Without Slowing Down Innovation?
Implementing an ISMS in financial services? Explore a practical, risk-aligned roadmap tailored for banks, fintechs, and insurers to meet ISO 27001, GDPR, and DORA compliance—without compromising agility.

How Do You Build a Robust ISMS Framework Based on ISO 27001?
Learn how to build a robust ISMS framework aligned with ISO 27001. Discover the key components—people, policies, processes, and controls—to strengthen security and achieve compliance.
.jpg)
When to Conduct Risk Assessments: 6 Enterprise-Critical Moments
Learn when to conduct risk assessments—annual, quarterly, after incidents or change—and how CERRIX ensures continuous compliance.
.jpg)
How do you build a system of quality management that works under ISQM 1?
Learn how to build a system of quality management under ISQM 1. Move beyond compliance to an operational model that proves audit quality.

Top GRC Platforms Compared: Risk Assessment Tools for 2025
Discover the top GRC platforms for 2025 with a focus on risk assessment tools.

What Are Risk Scoring Methods for Financial Institutions? [2025 Guide]

From Risk Assessment to Risk Management: Moving Beyond Checklists in 2025
Understand the evolution from risk assessment to strategic risk management in 2025. Learn why leading organizations are embedding risk into decision-making—and how GRC platforms like CERRIX support this shift.
What is risk management? A strategic guide for leaders in 2025

How Audit Firms Embed ISQM into Daily Practice
In our second ISQM webinar, experts from RSM, Grant Thornton, and CERRIX shared practical insights on how audit firms can embed ISQM into the heart of their operations.
.jpg)
What is the maximum fine for GDPR violations?
Discover the maximum fine for GDPR violations: €20 million or 4% of global turnover. Learn the two-tier penalty system, notable examples, and how to prevent costly data protection breaches.

How do you conduct a GDPR compliance assessment?
Learn how to conduct a GDPR compliance assessment with our step-by-step guide covering data mapping, documentation requirements, and 6 common gaps organizations discover. Reduce risks and ensure compliance.
What are the main requirements of GDPR?
Discover the 7 essential GDPR requirements every organization must follow. Learn about data protection principles, individual rights, breach handling, and practical compliance strategies in this comprehensive guide.
%20(2).jpg)
How often should you review third party risks?
Discover how often to review third party risks with our tiered approach: quarterly for high-risk vendors, semi-annually for medium, and annually for low-risk partnerships.

What should be included in a vendor due diligence process?
Discover what a comprehensive vendor due diligence process should include: financial stability assessment, security controls, compliance verification, risk evaluation criteria, and ongoing monitoring frameworks.

How do you assess vendor risk?
Learn how to implement vendor risk assessment in 5 clear steps. Discover essential strategies to protect your organization from third-party threats and ensure regulatory compliance.

What are the main types of supplier risks?
Discover the 5 critical types of supplier risks that threaten your business continuity. Learn effective strategies to identify, assess, and mitigate these vulnerabilities before they impact your operations.

What is a compliance risk assessment?
Discover how to conduct an effective compliance risk assessment to identify regulatory risks, prevent violations, and transform compliance challenges into strategic business advantages.
How do you report compliance violations?
Learn how to report compliance violations effectively through proper channels while protecting your identity. Discover documentation requirements, whistleblower protections, and what happens after you submit a report.

How do you calculate risk probability and impact?
Learn how to calculate risk probability and impact using proven methods. Transform uncertainty into measurable risks for better decision-making and strategic resource allocation.

What is third party risk management?
Learn what third party risk management is, how it protects your organization from external threats, and the steps to implement an effective TPRM program to ensure compliance and security.

What are the benefits of risk management for businesses?
Discover how risk management benefits businesses by protecting financial health, improving decision-making, ensuring compliance, and creating competitive advantages that transform threats into opportunities.

What is a risk register and how do you create one?
Wondering what a risk register is? Learn how to create this essential tool to identify, assess, and manage organizational risks effectively and boost compliance.

How often do ISO certifications need to be renewed?
Wondering about ISO certification renewal? Understand the three-year cycle, annual surveillance audits, and preparation strategies to maintain compliance seamlessly.

What documents are required for ISO 27001 implementation?
Discover the mandatory and recommended documents required for successful ISO 27001 implementation. Learn how to organize, create and maintain effective ISMS documentation that satisfies auditors and enhances security.

Do I need a consultant for ISO certification?
Wondering if you need a consultant for ISO certification? Discover key factors to make the right decision for your organization based on expertise, resources, and certification complexity.

What industries benefit most from ISO certification?
Discover which industries gain the most value from ISO certification. Financial services, technology, healthcare, and manufacturing organizations see superior ROI while enhancing compliance and competitive advantage.

Can a company lose its ISO certification?
Can a company lose its ISO certification? Discover the 8 common reasons, consequences, and prevention strategies to protect your business reputation and investment.

How long does it take to get ISO 9001 certified?
Discover how long ISO 9001 certification takes, from 4-12 months depending on your organization's size and complexity. Learn the key phases, challenges, and ways to accelerate your quality management journey.

What is ISO 27001 and why is it important for businesses?
Discover how ISO 27001 certification protects your business data, builds customer trust, and ensures regulatory compliance in today's high-risk digital landscape. A complete implementation guide.
From Spreadsheets to GRC Software: Why Pension Funds Need a Modern Approach to Risk Management
What to know about GRC software for nis2
Explore how GRC software helps businesses comply with the NIS2 Directive, enhancing cybersecurity and risk management.
Can automation reduce compliance costs?
Explore how automation can reduce compliance costs, enhancing efficiency and ensuring regulatory adherence.
What industries benefit from compliance automation?
Discover which 6 industries benefit most from compliance automation and how it transforms regulatory burdens into strategic advantages through risk reduction and operational efficiency.
How automation streamlines compliance processes
Discover how compliance process automation reduces costs by 40-60% while minimizing errors and risks. Transform manual workflows into strategic advantages for your organization.
Is cybersecurity compliance automation secure?
Discover if cybersecurity compliance automation strengthens or risks your security posture. Learn implementation best practices that enhance protection while simplifying regulatory management.
Does automation reduce compliance risks?
Explore how automation impacts compliance risks, its benefits, limitations, and integration strategies.
Key sectors affected by NIS2 compliance
Explore the impact of NIS2 compliance on key sectors like energy and healthcare, enhancing cybersecurity and data protection.

Are automated compliance tools reliable?
Exploring the reliability of automated compliance tools and their role in cybersecurity.
%20(1)%20(2).jpg)
DORA compliance checklist for beginners
An essential guide for beginners to understand and implement DORA compliance effectively.

Key benefits of adhering to DORA compliance
Explore the key benefits of DORA compliance, enhancing security, efficiency, and regulatory adherence.

NIS2 compliance: top strategies for success
Explore effective strategies for NIS2 compliance to enhance cybersecurity and regulatory adherence.

EU AI Act vs. GDPR: what's the difference?
Explore the key differences and overlaps between the EU AI Act and GDPR, focusing on regulation, impact, and compliance.

Can GRC tools predict compliance risks?
Exploring if GRC tools can predict compliance risks and their role in risk management.

Can a GRC tool adapt to regulatory changes?
Explore if GRC tools can adapt to regulatory changes, covering compliance management and risk assessment.
How does AI governance impact compliance?
Explore the impact of AI governance on compliance, focusing on regulation, ethics, and risk management.
.jpg)
How to prepare for the EU AI Act implementation?
Learn how to prepare for the EU AI Act implementation with practical steps for compliance.

Is your business ready for the EU AI Act?
Explore readiness for the EU AI Act with insights on compliance, challenges, and strategic planning for businesses.
.png)
How does DORA compliance impact financial sectors?
Discover how DORA compliance strengthens financial sectors, enhancing risk management, digital resilience, and regulatory standards.
.jpg)
What is DORA compliance and why does it matter?
Explore DORA compliance, its significance in financial services, and strategies for effective implementation.
DORA compliance vs other regulatory standards
Explore the differences between DORA compliance and other regulatory standards, focusing on financial regulations and cybersecurity.

Can automation improve DORA compliance efforts?
Explore how automation can enhance DORA compliance efforts by streamlining processes and ensuring ongoing monitoring.

How to integrate GRC with existing systems?
Integrating GRC with existing systems enhances compliance, risk management, and efficiency.
Can settlement discipline improve market stability?
Exploring how settlement discipline can enhance market stability, focusing on its benefits and challenges.

Why real-time analytics in GRC are vital
Real-time analytics in GRC is crucial for proactive risk management and continuous compliance monitoring.

Top 10 Features Every GRC Tool Should Have in 2025
Explore essential GRC tool features like integration, risk management, compliance, governance, and customization.

How to prepare your business for CSDR compliance?
Guide to preparing your business for CSDR compliance, covering key strategies, challenges, and technology solutions.

Embedding ISQM 1 into the DNA of Your Audit Firm: A Risk-Based Approach to Quality Management
Discover how to implement ISQM 1 with a risk-based approach. Learn how audit firms can embed quality management into daily operations and governance.
%20(1).avif)
CERRIX User Conference 2025
On March 12, 2025, industry leaders, assurance experts, and CERRIX customers came together for the CERRIX User Conference 2025—a day of knowledge-sharing, insightful discussions, and collaboration on the future of risk management, compliance, and AI-driven GRC solutions.

From Spreadsheets to GRC Software: Why Pension Funds Need a Modern Approach to Risk Management

CERRIX and BR1GHT Strengthen Long-term Partnership to Enhance Governance, Risk, Compliance and Audit Solutions

Implementing DORA: From Compliance to Long-Term Resilience
